werner@werner-amd64:~/oss/python_spice/test> ../src/spice_read.py complicated_binary.raw
The file: "complicated_binary.raw" contains the following plots:
  Plot 0 with the attributes
    Title:  * simulation de RC2
    Date:  Mon Sep  3 19:53:05  2007
    Plotname:  AC Analysis
    Plottype:  plottype undefined
    The Scale vector has the following properties:
      Name:  frequency
      Type:  frequency
      Vector-Length:  201
      Vector-Type:  float64
    Data vector 0 has the following properties:
      Name:  ac.v(n2)
      Type:  voltage
      Vector-Length:  201
      Vector-Type:  complex128
    Data vector 1 has the following properties:
      Name:  ac.v(n1)
      Type:  voltage
      Vector-Length:  201
      Vector-Type:  complex128
    Data vector 2 has the following properties:
      Name:  ac.v(n2)
      Type:  voltage
      Vector-Length:  201
      Vector-Type:  complex128
  Plot 1 with the attributes
    Title:  * simulation de RC2
    Date:  Mon Sep  3 19:53:05  2007
    Plotname:  DC transfer characteristic
    Plottype:  plottype undefined
    The Scale vector has the following properties:
      Name:  v-sweep
      Type:  voltage
      Vector-Length:  501
      Vector-Type:  float64
    Data vector 0 has the following properties:
      Name:  dc.v(n1)
      Type:  voltage
      Vector-Length:  501
      Vector-Type:  float64
    Data vector 1 has the following properties:
      Name:  dc.v(n2)
      Type:  voltage
      Vector-Length:  501
      Vector-Type:  float64
  Plot 2 with the attributes
    Title:  * simulation de RC2
    Date:  Mon Sep  3 19:53:05  2007
    Plotname:  Transient Analysis
    Plottype:  plottype undefined
    The Scale vector has the following properties:
      Name:  time
      Type:  time
      Vector-Length:  1069
      Vector-Type:  float64
    Data vector 0 has the following properties:
      Name:  tran.v(n1)
      Type:  voltage
      Vector-Length:  1069
      Vector-Type:  float64
|
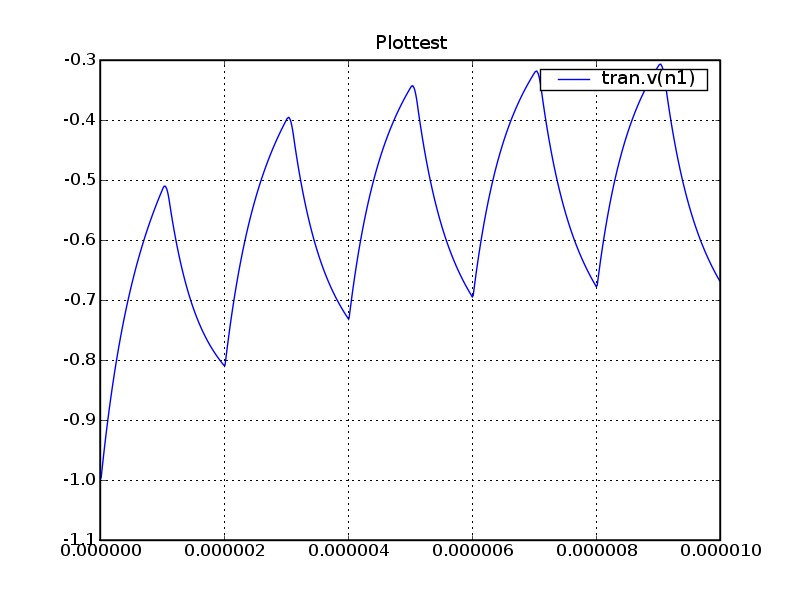
#!/usr/bin/python from pylab import * sys.path.append("../src/") import spice_read plotlist = spice_read.spice_read("../test/complicated_binary.raw").get_plots() plot2 = plotlist[2] x = plot2.get_scalevector().get_data() for v in plot2.get_datavectors(): plot(x, v.get_data(), label=v.name) title("Plottest") grid() legend() savefig("short_test.png") close() |
The script results in a simple plot written into a bitmap file:
The script spice2hdf5 reads spice files and writes them into a hdf5 file. The script can create tables of each simulation or store each vector of the simulation as an array. The command line interface offers some options to store the spice plots at different places in the hdf5 file.
werner@linux-m82i:~/oss/python_spice/src> ./spice2hdf5.py -h
spice2hdf5 version 0.0.2   (C) Werner Hoch
usage: ./spice2hdf5.py [options], spicefile, [spicefile2, ..]
  -h --help: print help information
  -v --verbose: print debug messages to stdout
  -o --outfile: specify the hdf5 output filename (default: out.hdf5)
  -p --pathprefix: location to store the spice data
  -f --format: whether to store the data as single vectors or table
               (default: table)
|
You can now store data in a hdf5 file
> spice2hdf5.py --pathprefix=/vectors -f vectors *raw > spice2hdf5.py --pathprefix=/tables -f table -o out.hdf5 *raw > spice2hdf5.py --pathprefix=/ac/myname ac_binary.raw > spice2hdf5.py -f vectors -o out.hdf5 dc_binary.raw |
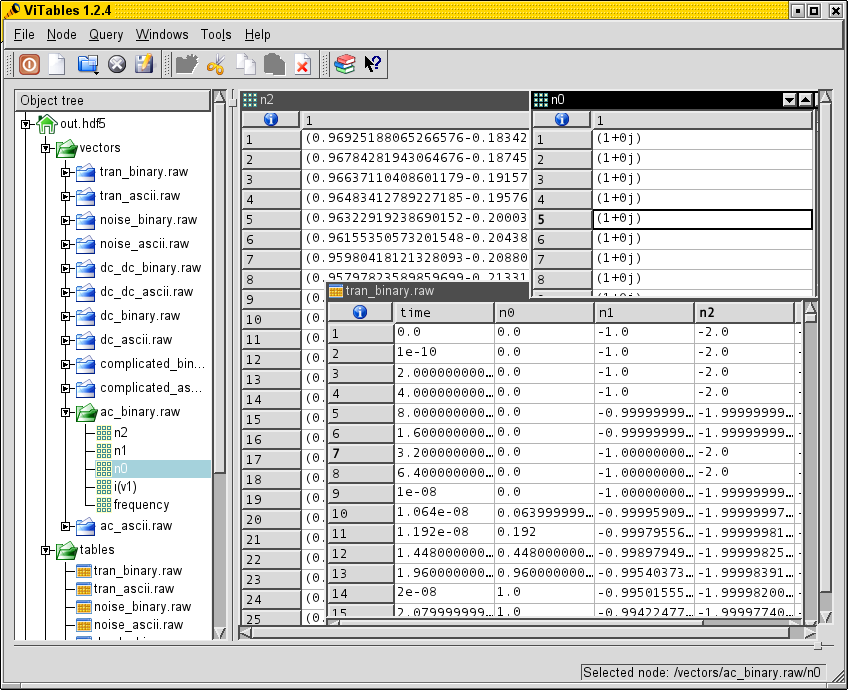
You can use the program ViTables to view the data stored in the hdf5 file and read it using the python tables module. Here is a screenshot from ViTables with some spice data:
programming language: python
natural language: english
licence: the DE-solver has a BSD-like licence, please read the
head of the src/diffev.py file. The spice import filter
src/spice_read.py and the conversion utility src/spice2hdf5.py uses
GPL2 all other files and examples are released into public domain.
download: python_spice-0.0.3.tar.gz